-
Re-fuelling tired immune cells to fight tumour
In this post, we discuss a publication in Nature Cell Biology, titled ‘Dapl1 controls NFATc2 activation to regulate CD8+ T cell exhaustion and responses in chronic infection and cancer’ The paper can be accessed here.
As we age, parts of our body become less functional. The same applies at the level of individual immune cells. T cells in our body are less likely to react to foreign antigens as we become older. This phenomenon is called exhaustion.
Exhaustion isn’t just an unfortunate outcome of ageing. It is a regulatory mechanism to curb an uncontrollable immune response, which can cause a cytokine storm (like COVID-19). A prolonged exposure to a specific antigen causes a chronic immune response. In such cases, T cells become exhausted and less functional. In effect, the body is protected from being attacked by its own T cells.
Cancer is one source of foreign antigen that can chronically activate our immune cells. Instead, however, immune activity against cancer is dampened via exhaustion (amongst other mechanisms).
We can give strong immune system back to old people and kill cancer, if we can understand the mechanisms of exhaustion, and how to revert it.
The scientists have focused the function of Dapl1 in T cell exhaustion.
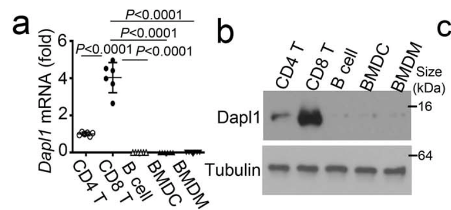
Dapl1 is specifically expressed in CD8 T cells. Isolated CD8 T cells express the highest level of Dapl1 compared to other immune cells. The authors show this by performing qPCR and western blot of isolated immune cells.
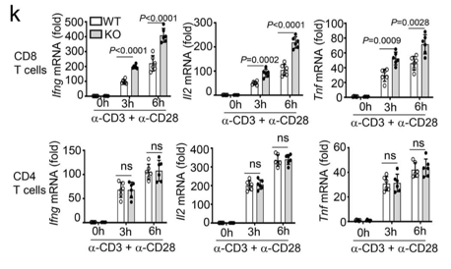
Dapl1 deficiency affects CD8 T cells specifically, and not CD4 T cells Only CD8 T cells are affected by the deficiency of Dapl1. The authors show this by stimulating CD8 and CD4 T cells with activating antibodies against CD3 and CD28. The expression of effector molecules, such as Ifng, Il2 and Tnf increases only in CD8 T cells.
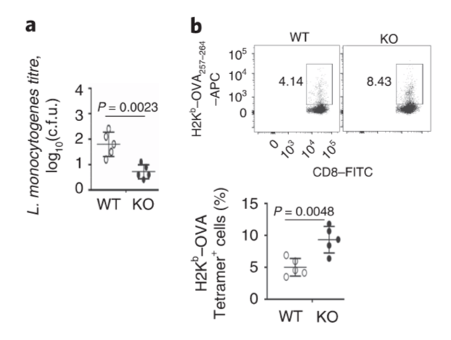
Dapl1-deficient mice (KO) have reduced bacterial burden in the liver compared to wild-type (WT). Dapl1-KO (KO) mice have robust response to bacterial infection. The authors infected mice with bacteria called L. monocytogenes. The particular bacterial strain expresses the antigen, called ovalbumin (OVA). KO mice have higher level of OVA-specific CD8 T cells.
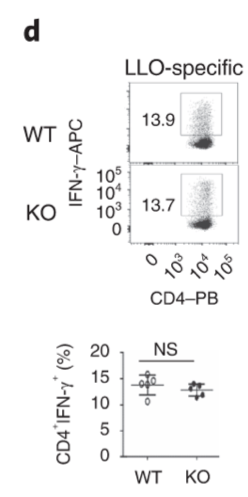
CD4 T cells are not affected by Dapl1 deficiency. Effector function of CD4 T cells are not affected by Dapl1 deficiency. The percentage of CD4 T cells producing effector molecules are unaffected in KO mice.
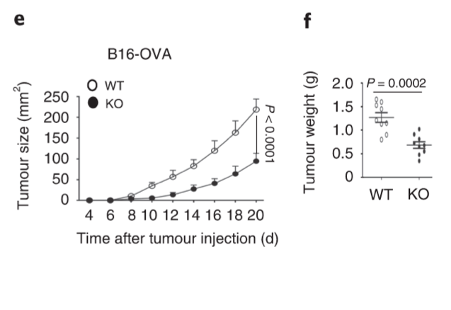
Dapl1-KO mice restrain tumour growth. Tumour grows slowly in Dapl1-KO mice. The authors show this by injecting B16-OVA melanoma cell line and monitoring the volume of tumour, and weight of the tumour at the end-point on day 20 after injection.
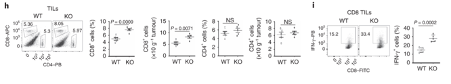
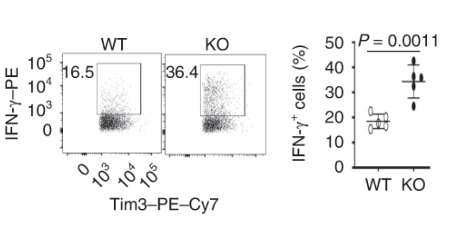
More effector CD8 T cells infiltrate the tumour in Dapl1-KO mice. More effector CD8 T cells infiltrate the tumour in Dapl1-KO mice. Dapl1 deficiency causes higher number of CD8+ T cell infiltration in the tumours. The infiltrating CD8+ T cells also produce more pro-inflammatory cytokine, interferon-gamma. The authors show this by profiling the percentage of CD8 T cells and CD4 T cells, and the expression of cytokine, IFN-gamma, by flow cytometry.
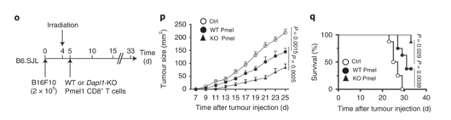
Tumour growth is slowed in Dapl1-KO mice. Survival rate also increases in Dapl1-KO mice. Growth of other tumours are also slowed down in Dapl1-KO mice. The authors use a model of melanoma cell injection, followed by irradiation to deplete the mouse of immune cells. Following irradiation, the mice are given either Dapl1-KO or WT Pmel1-specific CD8+ T cells that recognise and attack melanoma cells. Tumour growth is slowed down in mice that received Dapl1-KO CD8+ T cells.
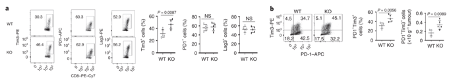
More CD8 T cells express the exhaustion marker, Tim3. More CD8 T cells express the exhaustion marker, Tim3. Tumour-infiltrating CD8+ T cells in Dapl1 KO mice have higher expression of exhaustion marker Tim3. Figure b is redundant, because what it represents is just a change in percentage of Tim3 expression. The authors the different markers of exhaustion, Tim3, PD1, and Lag3 in KO and WT mice.
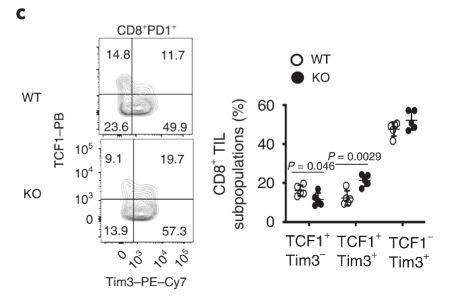
TCF1 expression is increased in Dapl1-deficient tumour-infiltrating Tim3+ CD8 T cells Tim3-expressing CD8 T cells also express higher level of TCF1. TCF1 is a transcription factor that helps to preserve effector functions in exhausted T cells. We see here that the exhausted tumour infiltrating Tim3+ T cells have higher expression of TCF1 in Dapl1 KO mice. Together, the figure suggests that Dapl1 restrains TCF1 to reinforce exhaustion.
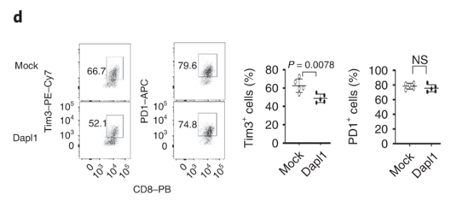
Transduction of Dapl1 expression in Dapl1-KO CD8 T cells decreases Tim1 expression Dapl1 functions intrinsically to CD8 T cells, and it suppresses Tim3 expression. The authors transduce Dapl1 expression in CD8 T cells obtained from Dapl1-KO mice. Transduction of Dapl1 decreases Tim3 expression.
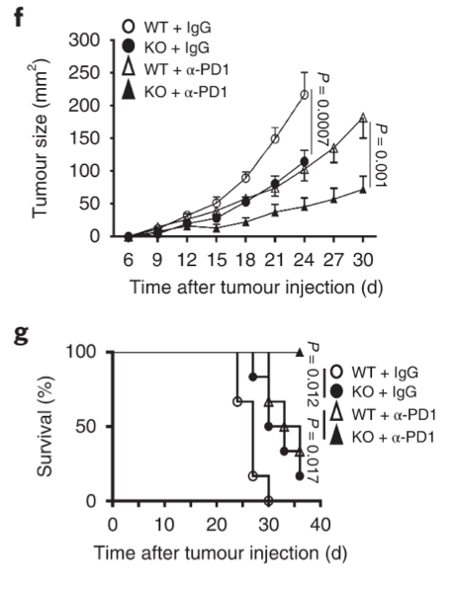
Dapl1-KO mice respond better to PD1 blockade Growth of tumour is strongly inhibited in Dapl1-KO mice receiving PD1 blockade therapy. The authors administer PD1 blocking antibody to tumour-injected mice and monitor their growth. Tumour growth was most strongly inhibited in Dapl1-KO mice receiving PD1 therapy.
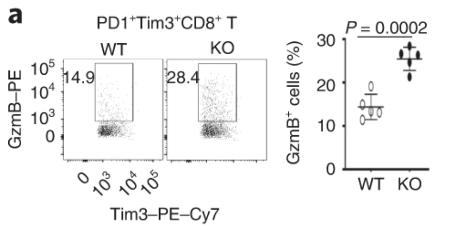
Dapl1-KO Tim3-expressing CD8 T cells express more effector molecules than their WT counterpart. Exhausted CD8 T cells lacking Dapl1 produce more effector molecules than their WT counterpart. Interestingly, Dapl1 KO CD8 T cells express more granzyme B and interferon-gamma, suggesting that they are more functional or effector-like. This observation is in contrast to the fact that Dapl1 deficiency causes increased expression of exhaustion marker, Tim3. The authors profiled the percentage expression of Granzyme B (GzmB) and interferon gamma in tumour infiltrating exhausted T cells.
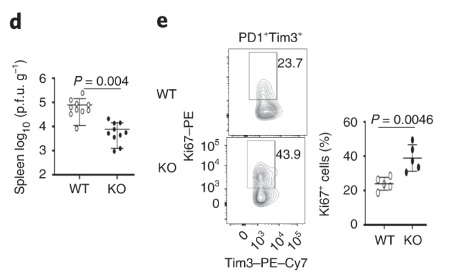
Dapl1-KO mice are less susceptible to viral infection Dapl1-KO CD8 T cells proliferate rapidly in response to viral infection. Dapl1 KO mice have reduced LCMV virus load in the spleen. The CD8 T cells are more proliferative as indicated by the increase percentage of Ki67+ cells.
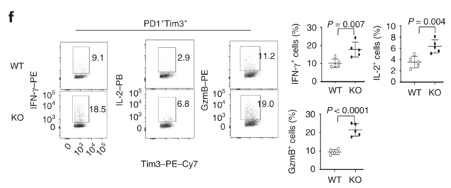
Dapl1-KO CD8 T cells also produce more effector molecules Dapl1-KO CD8 T cells produce more effector molecules in response to viral infection. The authors profiled the percentage expression of effector molecules IFNg, GzmB and IL-2.
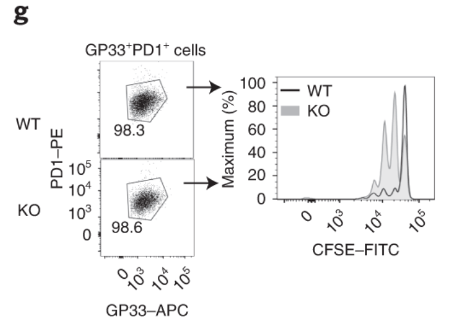
Virus-specific and Dapl1-KO GP33+ CD8 T cells proliferate rapidly Virus-specific and DApl1-KO GP33+ CD8 T cells proliferate rapidly. The authors cultured virus-specific exhausted CD8 T cells and performed CFSE dilution assay. Note that the CFSE dye is diluted more in KO CD8 T cells.
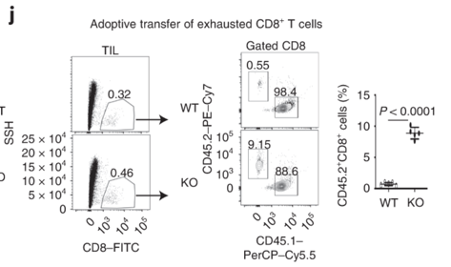
Dapl1-KO CD8 T cells colonise the recipient more readily than the WT CD8 T cells. Dapl1-KO CD8 T cells colonise the recipient more readily than the WT CD8 T cells. Interestingly, Tim3+ PD1+ exhausted Dapl1 KO CD8 T cells colonise the recipient mice far better than the exhausted WT CD8 T cells. This suggests that deficiency of Dapl1 or tampering with its function can re-instate effector and proliferative property to the CD8 T cells.
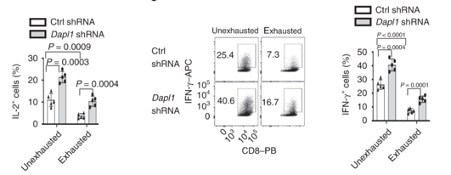
Dapl1 suppresses effector function Dapl1 suppresses effector function. As postulated above, knockdown of Dapl1 can increase expression of effector molecule IL-2 and Interferon-gamma in both un-exhausted and exhausted CD8 T cells. The authors have used short hairpin RNA (shRNA) to knockdown Dapl1 expression.
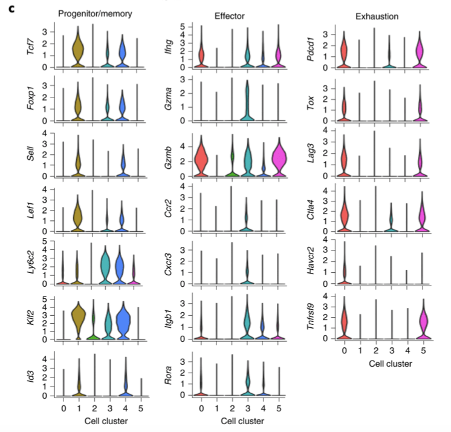
Tumour-infiltrating CD8 T cells are consisted of several sub-types. Single cell RNA-seq analysis shows diverse phenotypes of CD8 T cells. The authors performed scRNA-seq of tumour-infiltrating Dapl1 KO and WT CD8 T cells. Analysis generated 5 clusters. Cluster 1 and 4 are associated with progenitor/memory status. Cluster 0 and 5 are associated with exhaustion. Cluster 3 seems to be effector-associated.
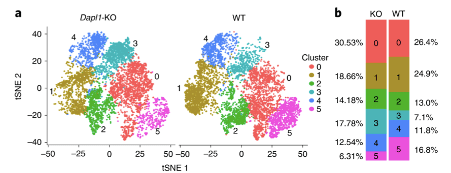
single cell RNA-seq analysis of WT vs Dapl1-KO tumour-infiltrating CD8 T cells More effector-like CD8 T cells are present amongst Dapl1-KO CD8 T cells than amongst WT CD8 T cells. Notably, the percentage of exhaustion-associated cluster 5 is reduced in Dapl1 KO CD8 T cells. Instead, the effector-associated cluster 3 has drastically increased in percentage. Together, the analysis suggests that there is a reduction in exhaustion and increase in effector sub-populations amongst Dapl1 KO CD8 T cells.
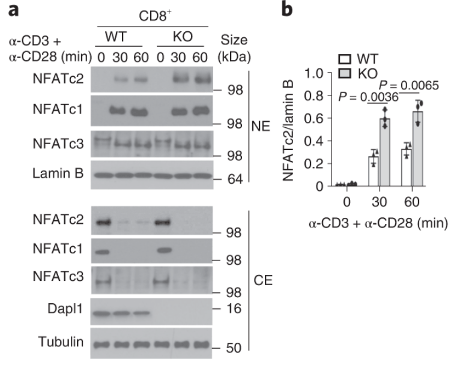
Dapl1 suppresses NFATc2 accumulation in the nucleus. Dapl1 suppresses NFATc2 accumulation in the nucleus. Stimulation of CD3 and CD28 causes more NFATc2 translocation in the Dapl1-KO CD8 T cells.
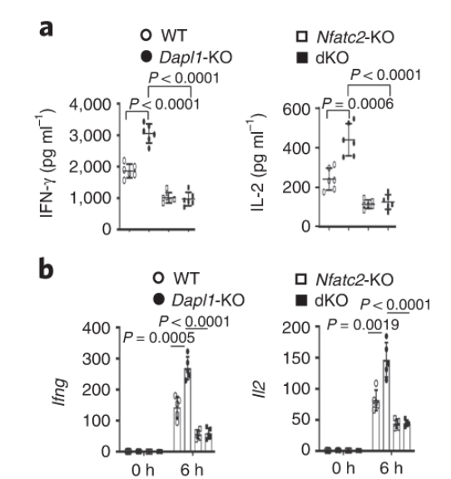
Nfatc2 functions downstream of Dapl1 Nfatc2 functions downstream of Dapl1. Expression of effector molecule is completely abolished in Nfatc2-KO CD8 T cells. Taken together with the immunoblot, evidence suggests that Nfatc2 works downstream of Dapl1 to increase expression of effector molecules IL-2 and IFNg.
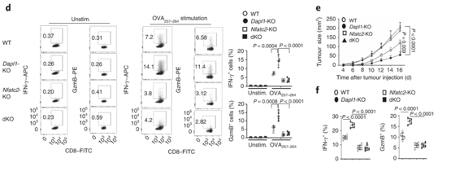
Nfatc2-KO mice are unable to restrain tumour growth Nfatc2-KO mice are unable to restrain tumour growth. Nfatc2-KO mice have reduced expression of effector molecules. Tumour growth is also unhindered in these mice.
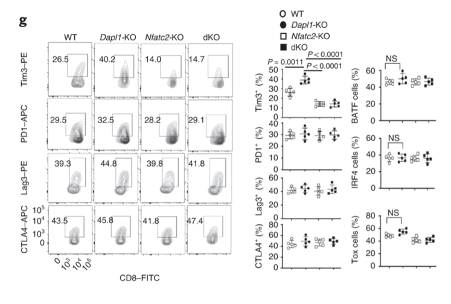
Expression of exhaustion markers return to basal level in dKO mice. Expression of exhaustion marker Tim3 returns to a basal level in dKO mice.
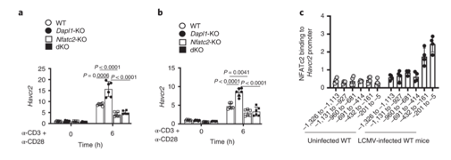
NFATc2 binding to Hacvr2 (Tim3) promoter occurs in response to LCMV infection NFATc2 binding to Hacvr2 (Tim3) promoter occurs in response to LCMV infection. The gene encoding Tim3 is called Havcr2. NFATC2 binding to Havcr2 promoter increases in LCMV-infected mice.
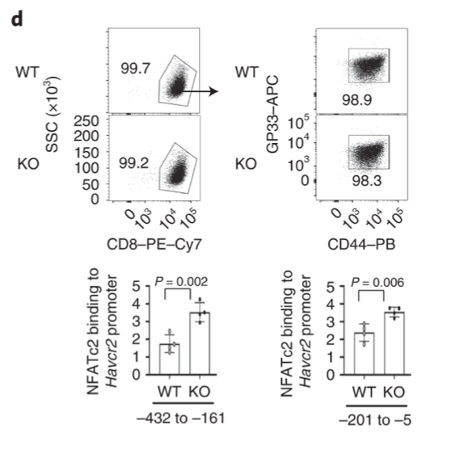
Dapl1 suppresses NFATc2 binding to the Havcr2 promoter Dapl1 suppresses NFATc2 binding to the Havcr2 promoter. Dapl1 KO mice have increased NFATc2 binding to Havcr2 promoter. This suggests that Dapl1 restrains NFATC2 binding to Havcr2 promoter.
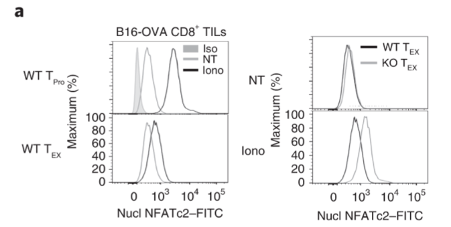
Exhausted CD8 T cells have reduced level of nuclear NFATc2. Exhausted CD8 T cells have reduced level of nuclear NFATc2.
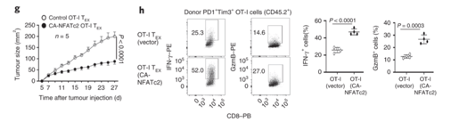
NFATc2 activity is sufficient to restrain tumour growth. NFATc2 activity is sufficient to restrain tumour growth. Authors transduced exhausted CD8 T cells with constitutively active NFATc2. This resulted in increased expression of effector molecules, and the ability to restrain tumour growth.
-
Exon 2 of Foxp3 controls Treg seeding of peripheral tissue, and maybe their stability
A publication in Science Immunology, titled ‘FOXP3 exon 2 controls Treg stability and autoimmunity’, explores how Foxp3 gene might function. The paper can be accessed here.
Background
The regulatory T cells (Tregs) are an important immune cell that suppresses other immune cells. They are important for suppressing activation of immune cells against our own body. A gene called Foxp3 is critical for the function and development of Tregs. Mutations in Foxp3 can manifest in auto-immune diseases in humans (The disease is called IPEX).
In humans, Foxp3 can exist as isoforms that either contain the full length (FL) of the mRNA transcript, or ones that lack the exon 2 (hereafter referred to as Foxp3 ∆E2 isoform). Patients who suffer from autoimmune diseases express a lot of the Foxp3 ∆E2 isoform. This suggests that the exon 2 is important for Treg function, but it is unclear how. The authors study what exon 2 of the Foxp3 gene does.
Figure 1 shows that IPEX patients have Foxp3 ∆E2 isoforms. Their Tregs can still become activated despite lacking exon 2.
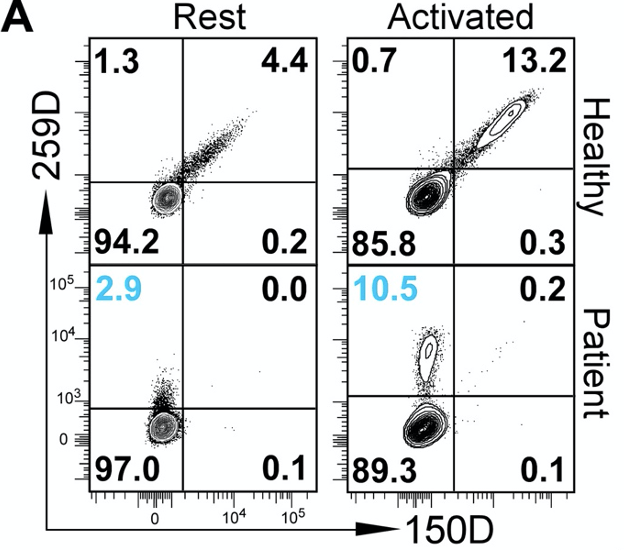
Figure 1A. Flow cytometric plot of Foxp3 expression in healthy humans or IPEX patients. 259D antibody binds to non-exon 2 portion of Foxp3 protein, and 150D antibody binds to the exon 2 portion. The authors sought to identify whether ∆E2 isoforms are found in IPEX patients. To do this, they used two different antibodies: 150D antibody that binds to the portion of the Foxp3 gene encoded by exon 2; and 259D antibody, which binds to the portion of Foxp3 protein that is encoded by other exons. Using these two antibodies, they saw that IPEX patients have Tregs that express a lot of ∆E2 Foxp3 proteins. The abundance of such Tregs increase upon their activation, showing that these cells are still competent to respond to activation signals downstream of CD3 receptors.
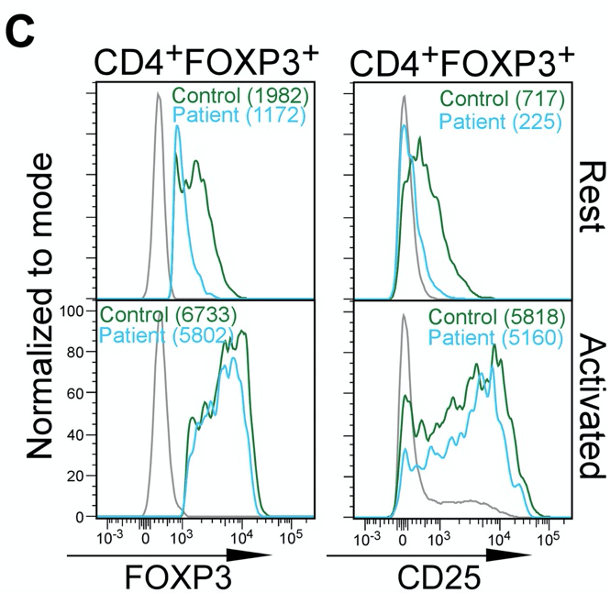
Figure 1C. ∆E2 Tregs of IPEX patients are phenotypically similar to healthy Tregs The authors also observe that the abundance of Foxp3 protein and CD25 (an indicator/marker for activation status of Tregs) is not dissimilar between Tregs of “Control” and “Patients”.
Figure 2 shows that lack of Foxp3 exon 2 causes systemic inflammation
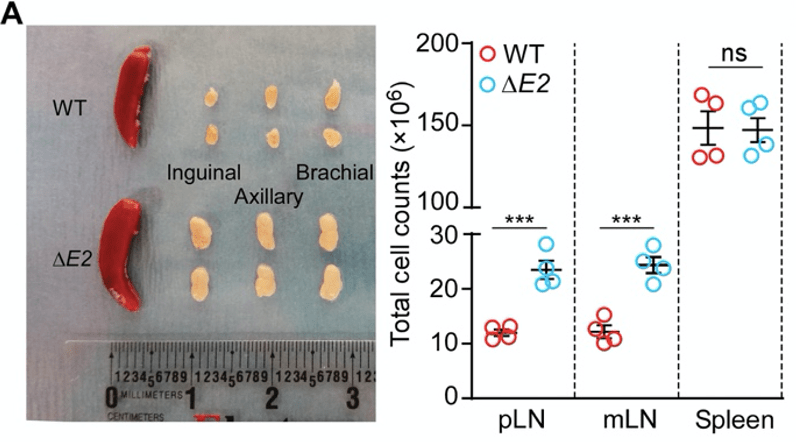
Figure 2A. Photograph of spleens from wild-type (WT) mice and ∆E2 transgenic mice. Red tissues are the spleens, and the creamy white tissues are lymph nodes (LNs). The authors produced mutant mice that lack exon 2 of the Foxp3 gene (these will be referred to as ∆E2 mice for convenience). In comparison to the healthy wild-type (WT) mice, the lymph nodes of the ∆E2 mice are enlarged. In parallel, the lymph nodes are packed with more cells. Together, these are indications of inflammation that is ongoing in the lymph nodes.
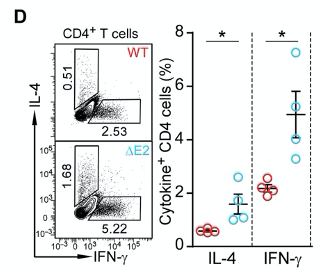
Figure 2D shows that ∆E2 mice produce more inflammatory cytokines IL-4 and IFN-γ. Indeed, when they profiled the production of cytokines in T helper cells, they observed higher production of intereferon gamma (IFN-γ) and interleukin 4 (IL-4) in ∆E2 mice.
Figure 3 shows that lack of exon 2 causes autoimmunity
Autoimmunity is a reaction of immune cells to their own body. The authors show that this occurs in ∆E2 mice by histological staining of tissues.
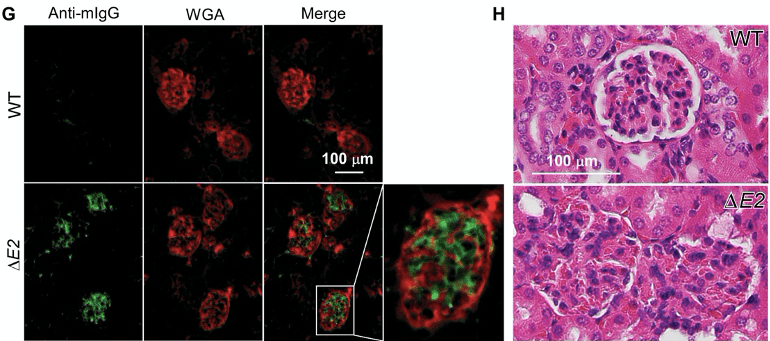
Figure 3G-H. Immunofluorescence images and H&E staining of kidney tissues. Mouse IgG antibodies (green) are bound to the kidney tissues in ∆E2 mice. Morphological structure of the glomeruli is destroyed as can be seen in 3H. The authors visualised presence of IgG antibodies (green) that are bound to their own kidney (red) in ∆E2 mice. The auto-reactive binding of IgG antibodies to the kidney is associated with the destruction of the glomeruli.
Figure 4 shows that Tregs of ∆E2 mice are not dissimilar to that of WT mice, and they possess the same suppressive capacity
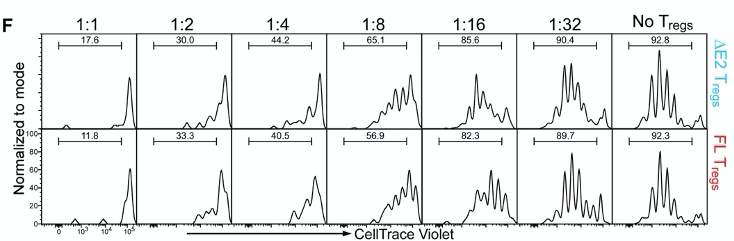
Figure 4F. In vitro suppression assay using co-culture of Tregs and T helper cells. Cells are dyed with CellTrace Violet, and the dilution of this dye indicates division of the cells. The authors co-culture Tregs and T helper cells at specific ratios as seen in figure 4F. The idea of this experiment is that functional Tregs will suppress the proliferation of T helper cells. Cells are dyed with CellTrace Violet, and this dye becomes diluted every time a cell divides. However, the authors did not see any difference in the dilution of the dye between ∆E2 Tregs and WT Tregs.
Figure 5 shows ∆E2 Tregs unable to establish presence in peripheral tissues as efficiently as WT Tregs.
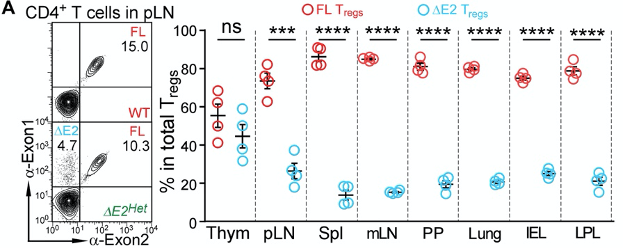
The authors profiled the abundance of ∆E2 Tregs in mice that have both ∆E2 Tregs and WT Tregs (A mouse has 2 copies of the Foxp3 gene. One of them is an ∆E2 allele, and the other is an WT allele. Such a mouse is referred to as being heterozygous). Peripheral tissues, such as the lymph nodes, spleen, lungs, and the intestines were largely occupied by WT Tregs, and not ∆E2 Tregs.
Overall, this suggests that whilst ∆E2 Tregs are functional, they’re unable to establish presence at peripheral sites. This could underly the auto-immune pathologies as Tregs cannot enter peripheral tissues to suppress other immune cells.
Figure 6 suggests that the Treg fate of ∆E2 Tregs is unstable
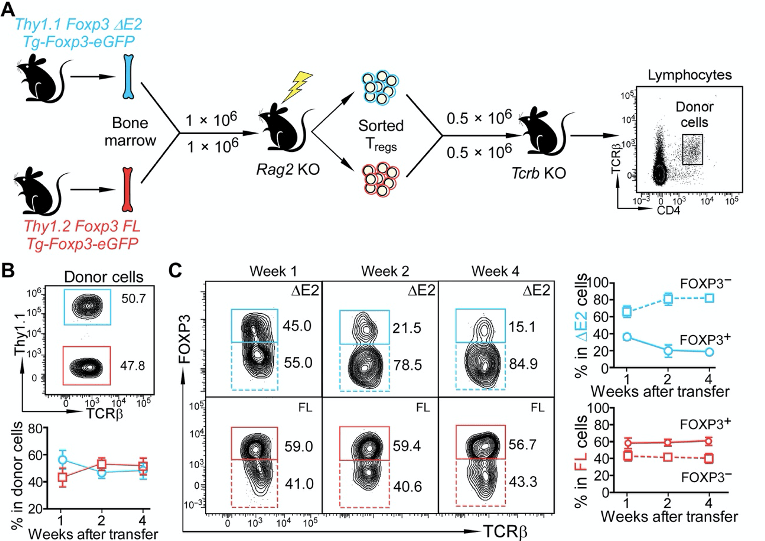
Figure 6A-B. Transfer of ∆E2 Tregs and WT Tregs to recipient mice The authors set out a goal to understand how ∆E2 Tregs might affect the Treg fate. In other words, could they steadily lose Foxp3 expression and become less Treg-like? They do this by using an adoptive transfer of ∆E2 Tregs and WT Tregs to recipient mice. I’m not sure why they address this question in this way. They could simply just perform a lineage tracing system. This would enable them to assess how cells that were once a Treg may or may not have lost Foxp3 expression.
In any case, they authors make a point that if they follow the Tregs over long term (panel B and C), the ∆E2 Tregs start becoming more Foxp3-negative. This suggests that lack of exon 2 might cause instability of the Treg fate.
The paper is then wrapped up with a bulk RNA sequencing study of ∆E2 Tregs vs WT Tregs. The results show that the ∆E2 Tregs express more cytokines, suggesting that they have adopted a more effector-like phenotype.
All in all, this is a very confusing paper that gives mixed messages. The in vitro systems show that ∆E2 Tregs are not dysfunctional. But, the last couple of figures seem to then suggest that actually ∆E2 Tregs are dysfunctional. What could have caused the auto-immune disorders in ∆E2 mice? I lean closer towards believing that the ∆E2 Tregs are functional, but they are less able to establish presence in the peripheral tissues.
-
Immune cells and stem cells
In this post, we discuss a publication in Nature Immunology, titled ‘Glucocorticoid signaling and regulatory T cells cooperate to maintain the hair-follicle stem-cell niche’. The paper can be accessed here.
This paper examines the role of regulatory T cells (Tregs). Tregs are a subset of immune cells that are known for its ability to control and suppress other immune cells. Their function is extremely important for keeping immune cells in check so that we do not develop allergy, or autoimmunity.
In recent years, scientists have discovered that the role of Tregs is not limited to their immune regulation. In the skin, it has been shown that they regulate the hair follicle stem cells, cells which are responsible for hair growth. The paper today explores how Tregs respond to steroid hormones and regulate hair growth.
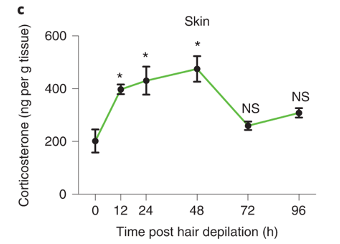
Figure 1 provides suggestive evidence that Tregs might utilise steroid hormone to regulate hair growth.
First, the authors remove the mice’s hair. The simple removal, called depilation, is known to stimulate the growth of hair. Shortly after depilation, the abundance of a steroid hormone (corticosterone) increases in the skin.
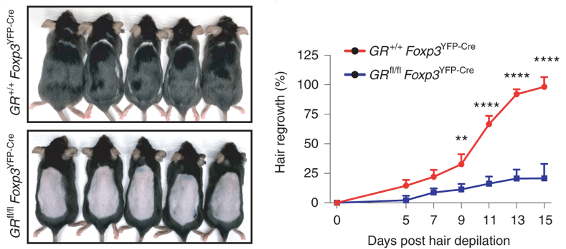
Panel c from figure 1 of the publication It turns out, that if Tregs lack a receptor for corticosterone (receptor is abbreviated as GR), mice are unable to regrow hair after depilation (bottom picture). For convenience, mice that with Tregs lacking will be abbreviated as GR-KO.
Panel e and f from figure 1 of the publication Figure 2 confirms defective hair growth when Tregs lack glucocorticoid receptors.
The hair follicle stem cells are the cells that divide and differentiate to produce the cells of the hair. The authors looked at how many cells are dividing (panel b) after depilation, and found that there is significantly less stem cell proliferation (panel c) in GR-KO mice.
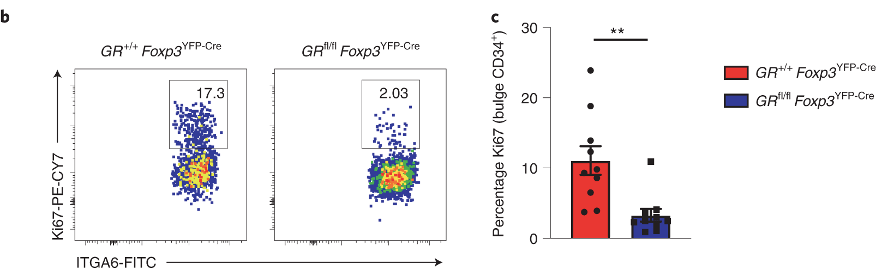
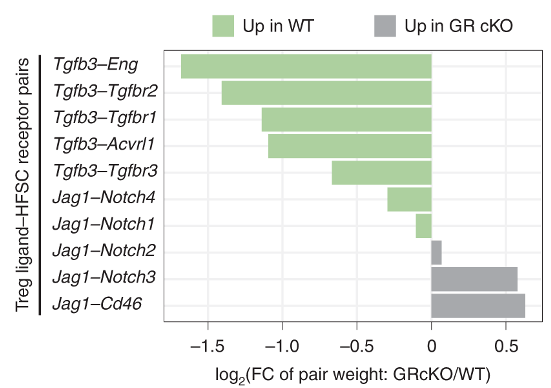
Figure 3 uses RNA-sequencing data to predict how Tregs and HFSCs might be interacting with each other
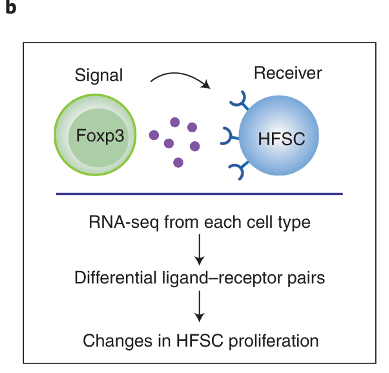
The authors sequenced the RNA obtained from Tregs and HFSCs after depilation. This allows them to find what ligand-receptor pairs they might have used to interact with one another. The process by which they do this involves looking at known database of ligand-receptor pairs. If any of those genes are differentially expressed in either the Tregs or the HFSCs, then we can say that the strength of interaction via the ligand-receptor pairs may have changed.
By using this approach, they identify that TGFb3 signalling may be important for Treg-HFSC interaction.
They confirm that the expression of Tgfb3 increases in Tregs upon depilation (DEX vs EtOH, panel f). The same occurs in GR-KO mice, but at much lower magnitude. For the most part, Tgfb1 can be ignored.
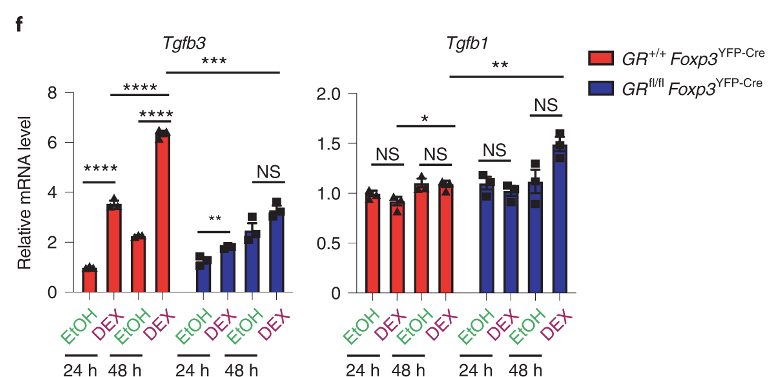
Figure 5 shows TGFb3 signalling is required for hair growth
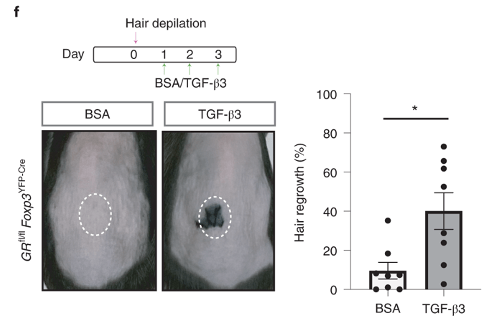
The authors injected beads that are soaked with TGFb3 after depilation of GR-KO mice. In BSA control mice, hair is unable to grow as a result of Treg defect. But, the beads are able to rescue hair growth. This provides concrete evidence that Tgfb3 is downstream of Tregs and regulates hair growth.
Figure 6 shows that HFSCs are less functional in GR-KO mice
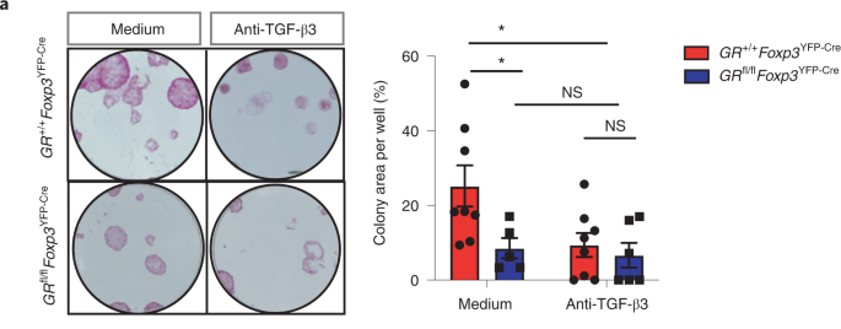
The authors purified HFSCs and grew them in the presence of purified Tregs obtained from either GR-KO mice or wild-type mice. The result is shown above (panel a).
Note that there is a sharp decline in colony formation (functional readout for HFSC growth) in GR-KO mice (medium). But, between medium vs anti-TGFb3 of GR-KO mice (blue), there is no difference. This suggests that HFSCs are unresponsive to TGFb3 in GR-KO mice.
Why is this so? Could HFSCs express lower level of TGFb3 receptor in GR-KO mice? We do not know. The expression level of TGFb3 receptors was not shown anywhere in the publication.
Overall, the publication shows evidence that Tregs utilise glucocorticoid receptors. The receptor is important for Tregs to regulate HFSC growth. Whether the regulation occurs via TGFb3 as the authors suggest is not fully supported.
-
Subscribe
Subscribed
Already have a WordPress.com account? Log in now.
